

But first, some history – I “remodeled” the basement from cinderblock with no bathroom to a 2 bedroom, 1 bath basement (with no kitchen) back in 2006. I put in radiant floors, and covered that with gypcrete. And then I kind of, sort of, ran out of time, money, energy, and a few other things.


OK – so the heated floor was thrashed. Step one was to level it.


Sand down floor leveler so it is actually level and smooth. Or, how to piss off your girlfriend.

Once we had level floors, we could proceed to the next flooring step (what we actually did was paint the walls and ceilings at this point – not sure why that was the order, but we have mastered how to destroy your weekends with household projects).
Basements, hard wood floors, moisture – not actually a good mix. So, there is nothing to be done about water coming from above (walls leaking, a leak in an upstairs shower, blowing out a washing machine hose – things like that). But – water coming in from below? “Make a swimming pool” said my flooring guru/project coordinator.


At some point in between the 2006 remodel and the 2020 project, I learned how to dance (theoretically)


Well, alrighty then! Back to our previously scheduled basement floor installation. The floor system combined 3 ideas that don’t play well together: radiant heat and wood and wood-on-concrete as a soft surface (for the dancing…) – so the design challenge was how to provide both a good nailing surface for the hardwood to adhere to, as well as some give and cushion for dancing or other activity in the basement, all without rendering the heating system unable to push heat through the layers, with things-that-are-soft usually being things-that-insulate.

Er, everywhere.

And on top of the rubber we placed plywood. Lots and lots of plywood (the basement is 1500 square feet – a modest sized modern home worth of renovating).


Girl, rubber underlayment and pile of yet-to-be placed plywood.

Now, I personally was quite done with this never-ending task of basement floor. Next up, knock together some boards for the finish layer. Piece of cake! (???)


76 bundles, 28 boards of mixed length per bundle. Ikea style (some assembly required). A 2,128 piece jigsaw puzzle.


Not to belabor our labor, but we could do, at best, 6 rows in an hour – and there were 273 rows – so ignoring closets (which are awful and terrible and take forever) we had over 45 hours just putting down the floor. Which I was going to finish by Christmas, 2019.
So, in February of 2020, we finished installing the pieces of the floor.


The right tool is a belt/drum floor sander. We were told by many people that we would put a divot in the floor with that tool, and never be able to fix it. So we opted for a Random Orbital Sander (this is an overgrown (12″X18″) palm sander). And while everyone says start at 80 grit, we found that didn’t really touch the problem (one sands a floor to get it level, remove any rough spots, and take out some of the planing marks from our super-affordable “utility grade” oak from Lumber Liquidators).
Here are a few people telling you this is a very dumb idea
https://howtosandafloor.com/can-you-sand-and-refinish-your-floor-with-an-orbital-sander/

So – the claim is with new wood, you can start with 60, maybe 36 if things are bad. After doing an entire room with 60-80-120 grit sequence, we realized we simply were not getting a good sanding. So, we started over at 20, then 36, than 60, than 80, than 120.

So, taking the same section of floor (a 7′ x 8.5′ chunk at one time) – it was 10–15 passes with 20, same for 36, 10 passes for 60&80, and 5 passes for 120. And, according to my Apple Iphone (as calibrated against Todd Callan’s Garmin system) – that translates into 19 miles walking behind that sander;
S L O W L Y


That same spot, now finished, and 6 months after the incidents depicted here.

Finished product


I wanted a wind break. A housemate left a pile of wood (for the fireplace) in the center of my gardening area. Searching the internet for goldfish (I kid) produced a link to a hugelkultur – and everything just clicked together (scroll on for photos and a short description).
Here is a link to the basic idea.
![IMG_2546[1]](https://thinklikewater.files.wordpress.com/2017/07/img_25461.jpg)
We started by digging out a bit – mainly for soil to put on the top. Note no “sod” – just some desert soil to use at the end.


Here is the base dug out, and the pile of wood that inspired the project.


After the base was dug out, we laid down chicken wire, cardboard, then pallets (which we have in excess), then the logs. The OSB (oriented strand board) was not included in the project, due to the glues, but it did protect the chicken wire we put down (this, in theory, keeps the gophers at bay – until the wire rots, of course. We put the cardboard down to crush their souls by taking away any daylight, even if they dug up to the wire).
All the logs in the previous photos were rolled by hand, and stacked by brute force, the two of us risking a bit of life and limb to get ‘er done.


The man we affectionately call “Redneck Neighbor Bill/best neighbor ever” had a Peavey, which he offered, and we ignorantly turned down – but eventually came to love. A caring, wonderful friend who is a fan of hand tools from frontier days also had a Cant. (The Peavey has a point at the end – it was designed for fiddling with logs on a river, but it was insanely useful for getting a bite into our desert soil to roll the log). What 2 people could barely move became doable with one person with the Cant/Peavey. Now educated, we used two at a time to make quick work of moving the logs, and with a few prayers, crushed fingers, and the requisite swearing, were able to stack the logs; all with two people – barely.
![Field conversion of Cant to Peavey (a wood threaded bolt on one side, and an all thread on the other end (single bolt) [one can imagine it was threaded straight into the handle, despite the visual evidence that this did not occur]](https://thinklikewater.files.wordpress.com/2017/07/img_25891.jpg)
The second Peavey comes online (having trouble labeling that picture – here is the label I wish it had: “Field conversion of Cant to Peavey (a wood threaded bolt on one side, and an all thread on the other end (single bolt) [one can imagine it was threaded straight into the handle, despite the visual evidence that this did not occur]”


“Weekend project” here near the end of the 2nd month. Unbenowst to us, wind, weddings and weariness were about to put a pause in the project – we were working a few hours a weekend on this, then lost six weeks to the above joys and maladies.


Bits and pieces – an Aspen tree that was dead and rotting – and a chain saw with a chain too dull to cut even this poor aspen (this too, was added to the hugel mound (the tree, not the chainsaw)) – and notice the deep faith the various vehicle owners have in my felling ablities; also – last years chicken run cleanout was part of the top soil solution.


I told lady friend that we could get rid of some of the pallets on the property. It seemed like a good idea, but the pallets would be something we did differently next time – the ones at the base seem fine, but we fought these pallets for each additional step – just too hard to get the next layers to stick with the pallets serving as a slide.


But hey, why not add MORE pallets (the end ones gave us the most grief, you can see the awkward corners – that didn’t get any better).
*more delays here as we enter month 4 of our “weekend project”*


And, just as the pallets were a possibly good idea, that turned out just barely OK – some friends’ crazy insurance requirement that they remove all of their pine needles from their yard turned out to give us that hugel mound feeling, and what could have been a bad idea turned out pretty good – these needles held together, and became the substrate that the topsoil (aka chicken compost (and another friend’s petrified horse manure) and that dirt from digging out the foot (which was – roughly – a foot deep)) clung to. About nine ancient, full bed pick-em up truck loads of pine needles on the mound.
And now we rush to press with the topsoil on (probably not thick enough at roughly 2 inches), and corn, clover, wildflowers, pumpkin, chilies and beans sprouting out of the mound -racing to get some roots in the soil before the AZ monsoons bring torrential, mound-eroding rains.


They say plant the three sisters in a mound. So I did (here the pumpkin and corn are visible, in other plantings the corn and the beans are visible, or pumpkin and bean – but at 6 days in, nowhere did all 3 sisters sprout. Not worried – yet).

corn and squash sprouts. Bean soon to appear?
Life sprouts – again!
[If you are looking for invoking Itunes song requests via Remote, this is not the blog you seek]
I had successfully avoided Apple turmoil in my life by not upgrading my Iphone past iOS 5, and Itunes 10.x. But, batteries die and screens crack, so I was off to a new Iphone 6s. Lots of surprises, a few even positive, but Itunes 12.x is a disaster! So much of the elegance and functionality gone, most urgently – Itunes DJ, which I used exclusively for 4-10 hours a day as my main music player for my home entertainment system.
I also rate songs as I go (I have >10,000), and move appropriate songs into playlists for DJing dances, and generally keeping things rolling along. Itunes 12 takes all that away (I believe they eviscerated the heart of the program in version 11 – I was blissfully unaware).
So – after reading article after article about how to do it, all of which failed pretty miserably, I fiddled around and found a way to kludge together a passable version of what I used Itunes DJ for. The first thing to do is give up on “Up next” – it is too crippled, and to rigid to restore the critical missing features.
Steps to restoring Itunes DJ
- Create a playlist, either smart or normal.
- Create a another playlist, this time a smart playlist
- Choose Match all (as opposed to any)
- Choose from the dropdowns for your first criteria – Playlist>is>(the playlist from step 1)
- Click the plus icon for another criteria.
- Choose Last played > is not in the last > x days (I use 4 days – but my playlist is huge).
- Check the Limit to and set the number of songs you want (as you could in Itunes DJ)
- Select “items” and “random” for the remaining choices next to Limit to
- Select Live updating (this is part of the secret sauce)
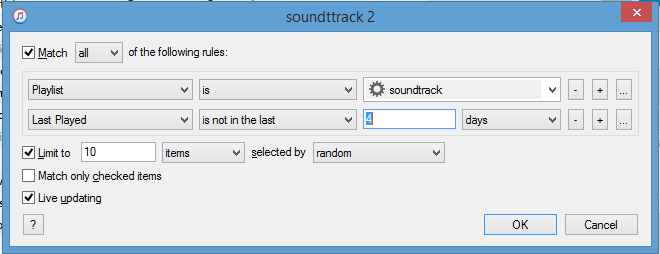
The heart of bringing back Itunes DJ
Now you can rate songs, and if you delete one from this playlist, it has no bearing on the underlying playlist, as it was in Itunes DJ. The final frustration was the braindead column selections that Apple included as their default for playlist.

Choose songs from the playlist dropdown
Near the upper right hand corner is the playlist dropdown, with a few choices. Songs restores the familiar columns, and you can re-arrange column order and choose which columns appear.
So – if you delete a song, one immediately replaces it – just like Itunes DJ. This does NOT do anything about people voting in songs via the Remote app – but the rest of the functionality is restored. Once a song is played, it immediately becomes “played within the last 4 (or 3 or 1 or whatever you chose in step 6 above) days” and live updates off your list. And now step 7 dictates a minimum of the number of songs you chose – so a new one appears. You can rate songs as well, and set the genre, re-arrange songs in the playlist and add to playlists via right click>add to playlist – all the things I found so useful and intuitive in Itunes DJ, which Apple nuked in version 11.
Oh – and “play next in Itunes DJ” maps to “Play next” – which, so long as you are already using the smart playlist approach detailed above, will put your requested song in “Up next” & Up next now shows your smart playlist selections as its feedstock – so you can use whatever vestigial features “Up next” has, including seeing previous songs played (the clock icon in “Up next”). It is cleaner to re-arrange songs in the playlist view than the Up next view, as “Up next” changes skips songs in the playlist, while re-arranging in the smart playlist works as expected.
With the non-stop attention on spending, deficits and debt, the popular understanding seems to be that Obama is a big spender and we must endure radical spending cuts and deep austerity to get back on track. The facts don’t support that analysis.
The Congressional Budget Office (CBO) tracks the historical figures on spending, deficits, size of government. It is truly interesting reading. Here are the stunning size-of-government numbers that should inform our discussion:
2009 3.518T
2010 3.4516T (did spending go DOWN? Yes, yes it did)
2011 3.598T
2012 3.538T (Again!)
2013 3.553 T (projected)
No news organization is reporting these figures, which seem like important context for discussions of budgeting, spending, deficits and debt.
More context: no President, going back 40 years has held spending steady for five years. If Bush had held spending constant for HIS first five years he would have reduced the debt by 346 billion (assuming revenue didn’t change, which is a bit of a stretch – as all that borrowed money was a stimulus for the economy). If he had held spending constant for all EIGHT years – He would have reduced the debt by a total of 2.256T (and that leaves 2009 out of the discussion).
Over five years, spending is up 1% – less than inflation, less than population growth. Obama has, in essence, shrunk government.
Meanwhile, the economy has grown, in the aggregate by 12.2% (from $13.974T in 2009 to 15.682T in 2012 – nominal figures) – the result, beyond the steep decline in annual deficits, is a notable reduction in the size of government.
In Bush’s final budget year, government spending exploded to 25.2% of GDP. In 2013, government’s percentage of GDP is down to 22.2%. Those numbers are notable – as they are as low or lower than 6 of Reagan’s years in office.
Beyond the numbers, the lack of reporting on these fundamental facts about our economy point to an amazing victory for the right wing’s takeover of not just right wing media, but media.
It is usually helpful to understand how we got to where we are before trying to fix it. So we left the story with spending at 3.5 Trillion dollars in 2009. Now, 5 years later, spending is at 3.5 Trillion dollars?!
Total government spending per person in constant 2005 dollars
Has there been a time in modern history when US federal spending has held constant for 5 years? There has not. Not since 1973 (as far back as the CBO/OMB data linked above goes).
This is an astounding thing, and not one our media has mentioned. There are in fact a few nominal dollar spending CUTS 2009 to 2010 and 2011 to 2012 – but that isn’t as important as just holding government spending constant and allowing the economy to grow – a fantastic way to cut deficits.
The impact of this has been to lower government spending as a percentage of GDP from the high of 25.2% to the 2013 percentage of 22.2% – which turns out to be as low or lower of a percentage of GDP than SIX of the years Reagan was President.
So the path to reducing (and ending!) the deficit is to keep a lid on spending. Obama has done that (with some help from slow Medicare spending growth (to his credit that was what Obamacare was designed to do)). If Obama’s 2nd term is EXACTLY like his first term, we can expect to see 12% economic growth, which translates to (conservatively) another 500 billion reduction in the deficit through growth alone. If we can get Congress to keep a lid on spending, that would put the deficit at 345 billion just by doing “nothing”. Indeed efforts to cut spending (ie auserity) tend to have the contrary effect of increasing government outlays and shrinking revenue.
While there is nothing wrong with shrinking areas of government that are too large, where you do it in the business cycle is hugely important. Bush added government stimulus to a roaring economy and brought on the Great Recession. Removing stimulus now (ie cutting spending) would be to apply a headwind to the still-too-small recovery. An OK policy applied at the wrong time.
So how do we get rid of the last 345 billion? Going back to Part I of this post, defense skyrocketed 356 billion between 2000 and 2009. Should we simply undo that run-up in spending? It may be tempting to the peace/fiscal responsibility crowd. But a more useful approach is to look at where defense was as a percentage of GDP in our last balanced budget.
2000 3% of GDP
2009 4.7% of GDP
2013 4.3% of GDP
So while a growing economy and frozen spending is bringing the big picture back in line (deficits down by 40% already) – defense took a disproportionate share of the doubling of government spending in the 2000s. So just holding it constant doesn’t fix the over spending on defense.
Working from the reasonable stance that the year 2000 balanced budget 3% of GDP is a reasonable approximation of the correct amount of spending on defense, the United States would spend 470.5 billion (15,681b X .03) on defense. The 2013 projected defense spending is 701.5 billion – so to return to a balanced budget, defense should be cut by 231 billion dollars per year.
That leaves the deficit at 104 billion dollars. Less than 1/10th of the deficit we had in 2009 – just by growing the economy and spinning down from a decade of foreign adventuring.
We finally turn to increasing taxes. And not just any taxes. The most wealth inequality boosting taxes of them all. “Death” taxes and capital gains taxes.
It is an economic truism that you tax what you don’t want. In the United States, payroll taxes are about 25%. And capital gains taxes are 15% (for the vast majority of us – 20% over 400k).
Raising taxes on non-earned income is appropriate for three reasons: It lowers the deficits, it shrink wealth/income inequality and it has the lightest touch on the economy overall (and of course rates have been MUCH higher historically)
40 billion from raising the capital gains rate from 15/20% to 20/25%
14 billion from estate taxes
Leaving us 50 billion in deficit spending – finally something small enough to drown in a bathtub!
Closing tax loopholes is almost cliche at this point. But it is discussed so often as it is a relatively painless way to both restore fairness and simplicity to the tax code AND reduce deficits.
Regardless of how often it is brought up, their is wide agreement that at least 50 billion is available from closing loopholes.
Note – lowered interest expense due to the eliminated deficit (and thus debt is lower than expected) is ignored. Let’s use THAT money to start paying down the debt!
There is fear and outrage at how large our deficits are. And, at 1+ trillion out of a 16 trillion dollar economy – there well should be. This is part one of a two part post. It is an analysis of how we got here, and a clear look at WHY we are here. The media likes to portray Obama and or Bush as big spenders. This post looks at the facts in that regard. The facts (based on comparing the last balanced budget to Bush’s last budget year) indicate claims that Bush left the United States of America with a one trillion dollar structural deficit are correct.
2009 is the pivotal year. To the casual eye, it appears Bush had declining (but HUGE) deficits from the mid 400 to mid 100 billion dollar range (once the tax cuts took effect). Then in 2008 the deficits turn on a dime and explode to nearly 500B.

Inflation adjusted chart of deficits
And in 2009 deficits triple! So, the question MUST be asked – what happened!?! (spoiler alert: TARP barely effected the deficit; ARRA (aka the Stimulus) also barely effected it). Let’s compare the picture from fiscal year 2000 (reference year because that is the last year the budget was in balance).
2009 budget changes from year 2000 budget:
+ 356B Defense
(314B) Revenue [2004 revenue (.998T)- 2004 revenue with no tax cut (1.416) less 25% of economic growth arguably due to stimulative effects of tax cuts]
+154B Tarp
+21B Interest expense
+26B Investments in education, training employment and social services
+180B Health (non Medicare)
+124B Income security
+49B Veterans affairs
+360B Energy, Natural resources, housing, transportation and Community/Regional Development
+50B ALL other functions of government
~1.6T in debt- that is the net effect of Bush budgets – and the similarity of that figure to the deficit itself in notable; almost ALL of Bush fiscal policy was deficit creating. HUGE growth in government, led by the defense runup, the cuts to government revenue with NO cuts in spending; beyond that, 360 billion mostly in the category “Commerce and Housing credit” (one presumes the fabled Bush “ownership society”/the housing meltdown). And of course the beginnings of the uptick in safety net spending due to the Bush recession (largely caused by the Bush runup in spending and other polices (ie ownership society (although Clinton also set the stage with low income loan requirements and relaxing government banking regulations)).
Of the above – $203B is due to Obama. The rest is the decade long runup in Bush spending.
+114B ARRA (Stimulus) (the rest spent in later fiscal years)
+89B Obama spending increases in March 2009 appropriations bills
The reasons the numbers don’t add up to 1.4T is the figure for “revenue lost” is calculated for one year (2004), but applied in 2009 – when we had a larger economy and minor disparity in numbers pulled from a variety of sources.

If we ended the Bush/Obama tax cuts
CBO data that verifies that 1.2 trillion of the 2009 deficit belonged to Bush.
“CBO projects that the deficit this year will total
$1.2 trillion, or 8.3 percent of GDP. Enactment of an
economic stimulus package would add to that deficit.”
The CBO report came out on January 7, 2009 – two weeks before Obama was sworn in. So we KNOW 1.2 trillion of the 2009 deficit (the inauguration of the 1 trillion+ budgets) came in under Bush
______________________
OK – so 2009 is the critical year in that the deficit goes from scary to terrifying. Let’s look at what has happened since (all data Treasury unless otherwise noted):
2009 1.4T
2010 1.3T
2011 1.3T
2012 1.1T
2013 900B (projected by OMB)
We are one third through 2013, so projections are likely reasonable, but the latest OMB report will be more accurate – reflecting the fiscal “cliff” outcome and continued slow recovery.
The 200B per year drop in the deficit since the crisis ended in 2011 is notable – adding up to a 35% reduction already (Obama promised 50% and delivered 35.7%). The data above is the accurate background for part II – how to get out of debt. It really is not hard and many Americans are embarrassed our government pretends it is such a huge challenge.
One thing our politicians are missing is analysis like the above – which shows where and how we got here, and of course points the way to how we get out.
{a note on tax cuts. It is very hard to winnow out the actual impact of tax cuts – both on revenue to the treasury and on GDP (interrelated problems). Here the tax cuts receive 25% of the credit for economic growth from 2000 to 2004. How and why would be another post. The second note is that the effect of any stimulative tax change is short term – the economy jumps up as people respond to the new money in their pocket, then reverts to pre-stimulative rates. And of course tax cuts which create deficits (as Bush’s did every year) should, in theory, have zero long term effect.}
So the Arizona ACC just put a bullet in the solar renewable market. Corporations no longer have access to the funds the corporations put into the system to fund solar projects (all funds for APS renewable energy incentives ultimately come from a surcharge on customers – the residential incentive is down to $.10/watt – or about $500 on a 20k project).
So who does get the money? APS – for utility level solar projects. In other words – if you are a monopoly provider/ginormous corporation – the Arizona Corporation Commission has your back.
If you are a customer of APS – you are welcome to pay into the system (which was designed to expand distributed energy) – but you will see no benefit from it.
Elections have consequences. Arizona citizens voted in the right wing GOP anti-solar extremists. And this is their first of many, many actions to kill renewable energy in “the sunshine state”
